|
|
Tapaas Client Profiler allows its users to examine real-time and historical trading behaviour and provides an in-depth analysis of individual traders profitability.
With Client Profiler, the users can identify and/ or monitor:
- Real-time and historical winners and losers;
- Real-time symbol risk and the clients trading the particular symbol;
- Trader’s detailed performance at intra-day or EOD, i.e. PnL, Equity, Exposure, Leverage, Margin, margin level; and
- Specific trading behaviour, i.e. scalpers, newstraders supported by the Label Manager
Which traders are performing well today and historically?
There is a straightforward way to identify high/ low-risk clients and determine if they should be STP’d or warehoused.
The users can find the top 1000 winners and losers of the current day, based on daypnl.
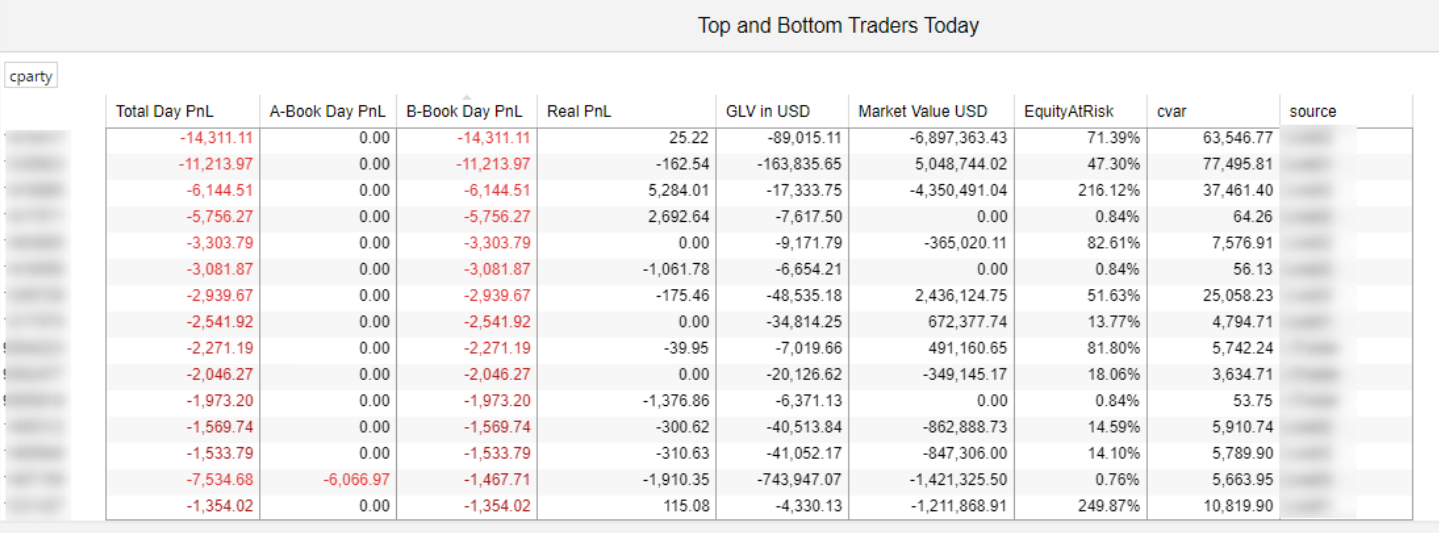
And also the Top and Bottom performing traders over the periods of 30, 90 and 180 days, by book.

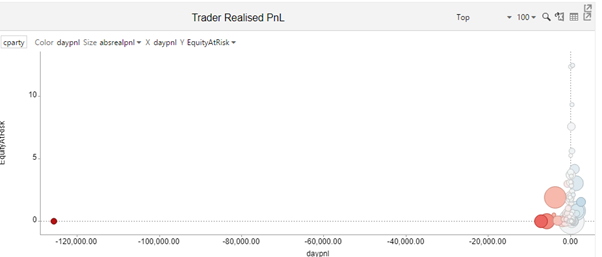
Client Profiler also offers a graphical representation of the profitability of the traders, which the user can customise, as the Size Variable of the bubble in the bubble chart can be set to either display absolute realised pnl or equity.
The X and Y axis can also be set to other variables, such as VaR, equity at risk and realised PnL.
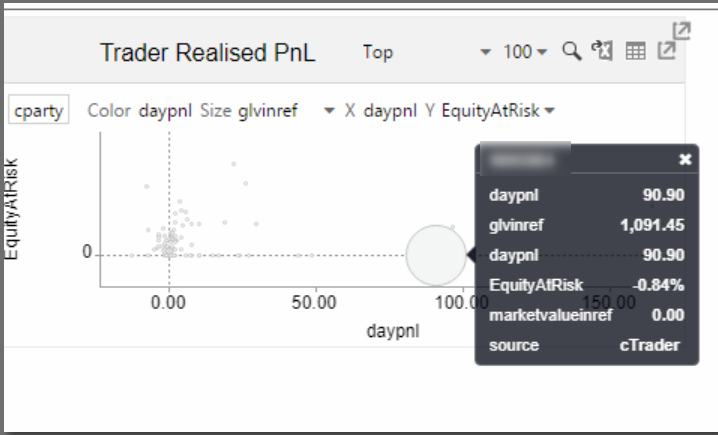
With a hover the user gets more details of a trader’s behaviour to form a better picture.
Which symbols are of high-risk today?
Our users can also view the current risk by symbol and identify the clients that are trading this symbol on the current day.
Trading activity for each symbol at the current day is presented in a table. With the appropriate sorting, the user can extract meaningful indications, i.e. which is the symbol with the greatest absolute exposure today.
By choosing a symbol from the menu, the table at the bottom displays clients trading this symbol today.

Which clients have exhibited certain behaviors lately?
Identifying scalpers, toxic clients, price arbitrageurs and more has never been easier.
The module named “Label Manager” precedes the Client Profiler tool. But, the two are now integrated, forming a solid solution for profiling traders.
With Label Manager, the user examines certain trading behaviors thoroughly, by looking at the labels, which are self-explanatory, i.e. Scalper, Price Arbitrageur and also their positions – DayPnL, equity and exposure.
By using the proper filters, the user can constrain the tab to display only accounts with specific labels.
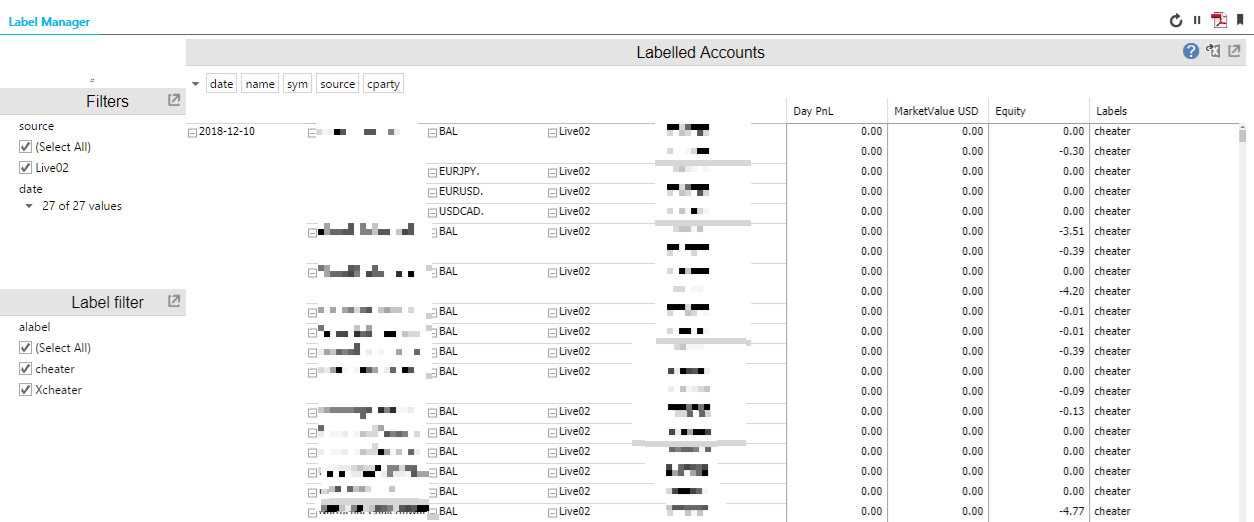
Labels are automatically applied by the system or manually by a user. This option allows the users to create their own labels to monitor a list of accounts with common special attributes.
Find all you need to know about a particular trader
A comprehensive analysis of the trader’s account; their details, PnL, equity, open positions, exposure, closed trades, payments, swap, commission, margin and leverage used for up to 30 days back.
The “Trader Report Card” provides details on a selected trader including Day PnL, Equity and Payments. In addition, the “Trader Report Card” also shows the label assigned to this trader and the last time this label was updated.
“Trader Report Card” displays details about the trader’s account, which includes their name, account number, leverage, country of residence.

The rest of the tables show:
- Daily PnL for the account by Book;

- Daily equity for the account, with the option to toggle between a net view and a view in which the cash and unrealised profit are shown separately.

- A summary of the different types of payments applied to the account. To see the deposits and withdrawals in more detail, the user executes the ”Examine Payments” action. The details will be shown in a separate “Deposits and Withdrawals” table.

- Three different EOD metrics for the account; the total daily traded amount in USD, the Absolute Market Value in USD and the Leverage used. Leverage used is defined as the Market Value divided by the Equity.

- Cumulatative daily PnL by Book for today and the last 30, 90, 180 days

- Labels that are currently applied to the account and the date the label was last updated

- Current open positions in each symbol for this account

- Closed trades during the specified duration

Assessing intra-day risk for a trader for current day and historically
Another tab, named “Client Positions”, contains a series of tables and charts that allow the user to assess intra-day risk within a historical range that extends to the current day.
Details about the trader’s account, which includes their name, account number, leverage, country of residence are also available.

Intra-day risk is displayed across different charts. Chart 1 displays a Trading Summary across a date range in account currency. The metrics shown are:
- Market Value aka Exposure
- Equity
- Leverage Used
- Margin
- Margin Level
- Cash Balance
- Unrealised/ floating profit
- Realised Profit

Another chart shows Unrealised PnL per symbol in Account Currency across the date range.

And a third one shows the Total market value of all positions, valued in account currency across the date range.

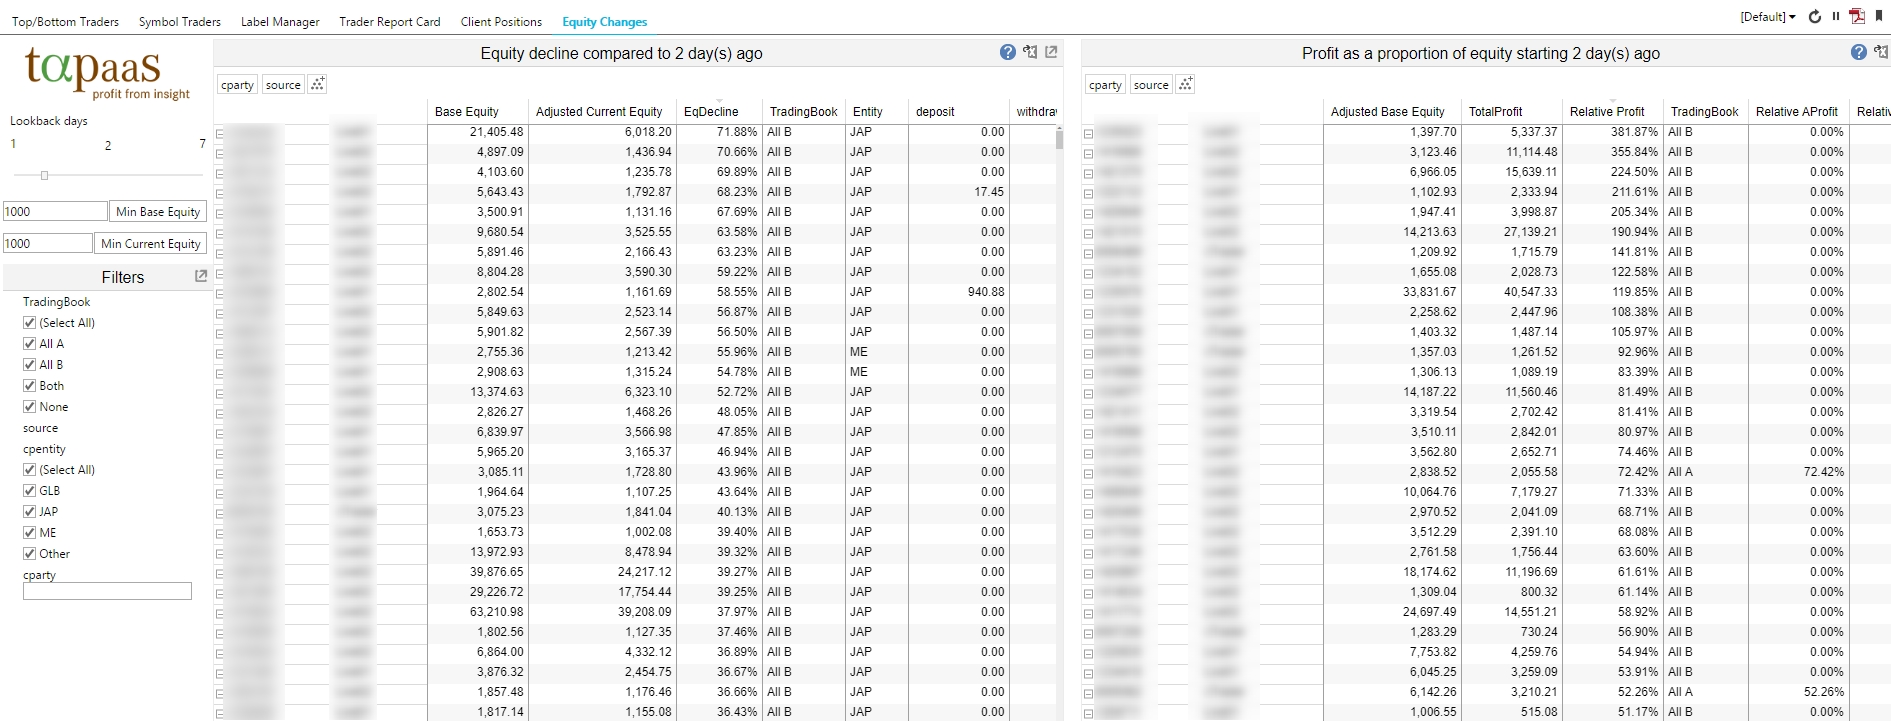
Analysing clients’ change in equity
Another dashboard, named Equity Changes contains a pair of tables to show:
- Accounts where the equity has dropped
- daypnl as a % of previous EOD equity
Contact Us
For any questions or for registering interest in Tapaas, please submit an inquiry here.


No comment yet, add your voice below!