“Why was my order not traded at the requested price?”
This question might sound familiar – it is among the most common ones our customers get from traders all the time, which they need to answer within a short amount of time. The answer, however, is not always obvious and it may take a while to be given, especially if the appropriate information and toolset is not available.
The above question camouflages a real challenge, which is the inability to track and analyse spread and quotes behaviour more accurately and efficiently, identify spikes, slippage and the possible causes of these. Not being able to monitor, analyse and detect when spreads widen and when the requested price is not filled, can negatively impact a broker’s business.
We soon realised that brokers ought to have a mechanism that will allow them perform the above; to examine quote and spread patterns, identify and analyse slippage and in overall detect the causes of each in a more effective manner.
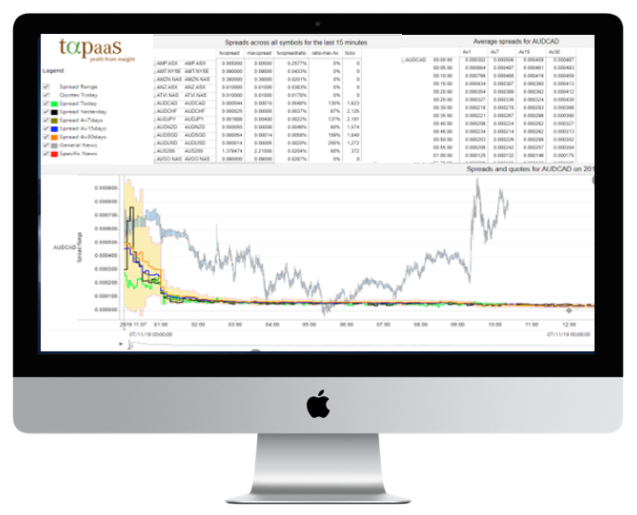
In Tapaas, we have built various solutions to exhibit real time and historical behaviour of ticks, such as charts for quotes, spreads and best execution. Yet, in order to address the above challenge, we developed a comprehensive solution by coupling existing tools with enhanced analytics. The new solution allows brokers to monitor quotes and spreads behaviour over longer periods of time, for multiple symbols, also relating spreads behaviour to certain events, which might be the reason for high volatility causing slippage.
This integrated solution, called Tick Metrics, gives our customers much more; the ability to look back up to a month to identify tick metrics of a particular symbol, to watch symbol spreads of the past and of real time, allowing them to analyse patterns and draw their conclusions. More specifically, they can:
• View Spread metrics for all symbols for the last 15 minutes;
• Search for Spreads and quotes for a particular past date;
• Identify what the average spread for multiple symbols was yesterday, over the last 7, 15 and 30 days;
• Give reasoning to extreme spread behaviour by examining the impact of important events on spreads’ of particular symbols; and
• Search spreads at a particular time of the day during the last 5 trading days.


No comment yet, add your voice below!